
File:Figure 2.jpeg
Original file (1,086 × 724 pixels, file size: 129 KB, MIME type: image/jpeg)
Figure 2. Images demonstrating representative cases of each grade of the meibomian gland changes. The upper and lower eyelids were turned over and meibomian glands were observed using an infrared transmitting filter and an infrared charge-coupled device video camera. Changes in meibomian glands were scored using the following grades in each eyelid (meiboscore): grade 0, no loss of meibomian glands; grade 1, area loss was less than one third of the total meibomian gland area; grade 2, area loss was between one third and two thirds; grade 3, area loss was more than two thirds. Reprinted with permission from American Academy of Ophthalmology from the article by Arita, Reiko et al (2008), Noncontact Infrared Meibography to Document Age-Related Changes of the Meibomian Glands in a Normal Population published in Ophthalmology, 115: 911-915.
File history
Click on a date/time to view the file as it appeared at that time.
| Date/Time | Thumbnail | Dimensions | User | Comment | |
|---|---|---|---|---|---|
| current | 17:32, March 2, 2021 | | 1,086 × 724 (129 KB) | Benjamin.ghiam (talk | contribs) | |
| 09:09, December 1, 2016 | 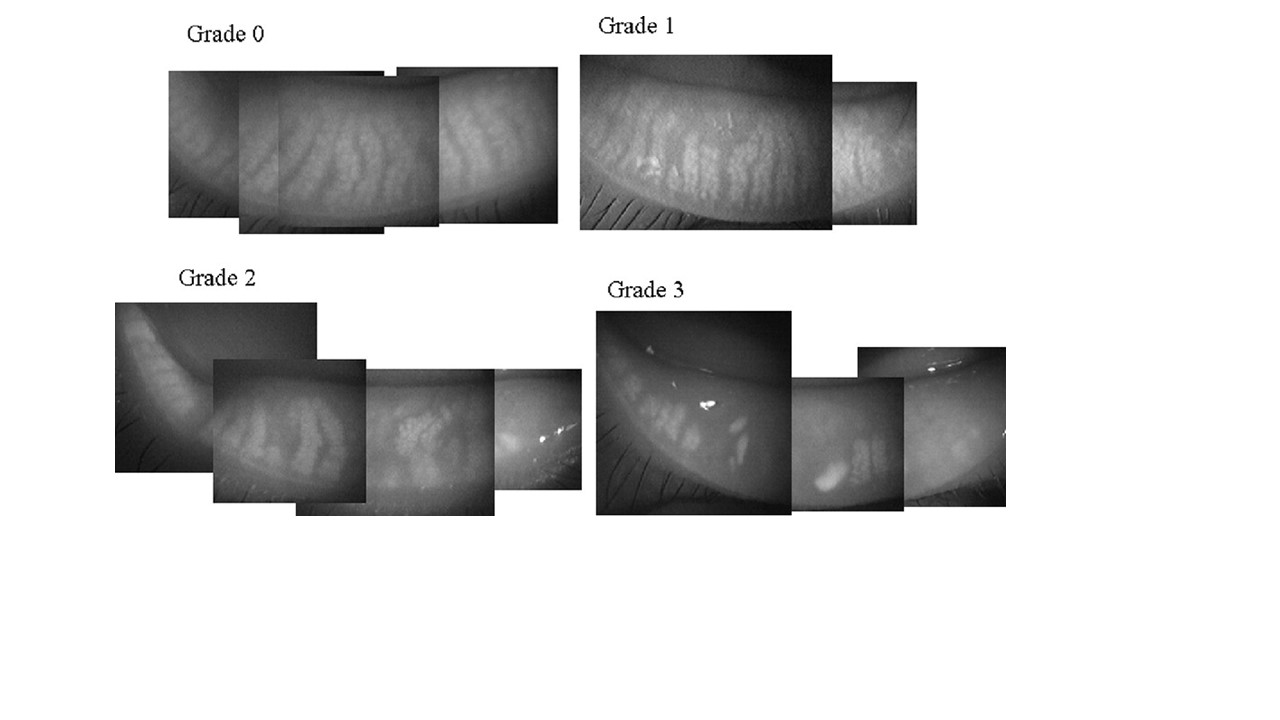 | 1,280 × 720 (71 KB) | Deepak.Sambhara (talk | contribs) | Figure 2. Images demonstrating representative cases of each grade of the meibomian gland changes. The upper and lower eyelids were turned over and meibomian glands were observed using an infrared transmitting filter and an infrared charge-coupled dev... |
You cannot overwrite this file.
File usage
The following file is a duplicate of this file (more details):
There are no pages that use this file.